Configure Azure Monitoring Using the Telegraf Data Collector
You can collect custom metrics for the Hyper-Q VM with the InfluxData Telegraf agent. Telegraf is a plug-in-driven agent that enables the collection of metrics from different sources. Depending on what workloads run on your virtual machine, you can configure the agent to leverage specialized input plug-ins to collect metrics.
The Telegraf agent is integrated directly with the Azure Monitor custom metrics REST API. It supports an Azure Monitor output plug-in. By using this plug-in, the agent can collect workload-specific metrics on your Linux virtual machine and submit them as custom metrics to Azure Monitor. To learn more, see the Telegraf documentation.
This chapter contains the following sections:
Configure Hyper-Q Logging for Azure Log Analytics Learn how to use Azure Monitor to collect data directly from your Azure virtual machines into a Log Analytics workspace for analysis.
Configure Azure Monitoring Using the Telegraf Data Collector You can collect custom metrics for the Hyper-Q VM with the InfluxData Telegraf agent.
Install the Telegraf Data Collector
You install the Telegraf data collector on each Hyper-Q VM.
Prerequisites
The Hyper-Q VMs must have managed identity enabled. To learn more, see the Microsoft Azure article Configure managed identities for Azure resources on a VM using the Azure portal.
To install the Telegraf agent:
Sign into the Azure portal.
Log into the Hyper-Q VM in the Azure workspace using SSH.
Download the Telegraf agent to the Hyper-Q VM.
Visit the InfluxData Downloads portal, and download the Telegraf data collector for RedHat and CentOS.
Install the Telegraf agent on the Hyper-Q VM.
To learn how to install the Telegraf agent, see the Telegraf documentation and follow the RedHat and CentOS installation instructions. See Install Telegraf.
Generate a Telegraf configuration file.
The configuration file defines the Telegraf agent’s operations. A sample configuration file is located at:
/opt/datometry/config/azm-telegraf.confSpecify the plugin
cpu:mem:statsd:net:netstat:disk:diskio:systemd_units:net_responsefor the input filter, andazure_monitorfor the output filter. Generate a new Telegraf configuration file using the command below, and replace the example configuration file with the newly generated file.telegraf --input-filter cpu:mem:statsd:net:netstat:disk:diskio:systemd_units:net_response --output-filter azure_monitor config > azm-telegraf.conf
Copy the newly generated Telegraf configuration file to the directory
/opt/datometry/config/azm-telegraf.conf.sudo cp azm-telegraf.conf /etc/telegraf/telegraf.conf
Restart the Telegraf agent.
$ sudo systemctl stop telegraf
$ sudo systemctl start telegraf
View the Telegraf agent status and ensure that the agent is listening on UDP port 8125.
$ sudo systemctl status telegraf

telegraf.service - The plugin-driven server agent for reporting metrics into InfluxDB

   Loaded: loaded (/usr/lib/systemd/system/telegraf.service; enabled; vendor preset: disabled)

   Active: active (running) since Tue 2021-02-23 21:31:36 UTC; 8s ago

     Docs: https://github.com/influxdata/telegraf

 Main PID: 32130 (telegraf)

   CGroup: /system.slice/telegraf.service

           └─32130 /usr/bin/telegraf -config /etc/telegraf/telegraf.conf -config-directory /etc/telegraf/telegraf.d


Feb 23 21:31:36 hyper-q-vm systemd[1]: Started The plugin-driven server agent for reporting metrics into InfluxDB.

Feb 23 21:31:36 hyper-q-vm telegraf[32130]: 2021-02-23T21:31:36Z I! Starting Telegraf 1.17.2

Feb 23 21:31:36 hyper-q-vm telegraf[32130]: 2021-02-23T21:31:36Z I! Loaded inputs: cpu mem net netstat statsd

Feb 23 21:31:36 hyper-q-vm telegraf[32130]: 2021-02-23T21:31:36Z I! Loaded aggregators:

Feb 23 21:31:36 hyper-q-vm telegraf[32130]: 2021-02-23T21:31:36Z I! Loaded processors:

Feb 23 21:31:36 hyper-q-vm telegraf[32130]: 2021-02-23T21:31:36Z I! Loaded outputs: azure_monitor

Feb 23 21:31:36 hyper-q-vm telegraf[32130]: 2021-02-23T21:31:36Z I! Tags enabled: host=hyper-q-vm

Feb 23 21:31:36 hyper-q-vm telegraf[32130]: 2021-02-23T21:31:36Z I! [agent] Config: Interval:10s, Quiet:false, Hostname:"hyper-q-vm", Flush Interval:10s

Feb 23 21:31:36 hyper-q-vm telegraf[32130]: 2021-02-23T21:31:36Z I! [inputs.statsd] UDP listening on "[::]:8125"

Feb 23 21:31:36 hyper-q-vm telegraf[32130]: 2021-02-23T21:31:36Z I! [inputs.statsd] Started the statsd service on ":8125"
Start the dtm-monitors.timer to send custom metrics to the monitor service.
$ sudo systemctl enable dtm-monitors.timer

$ sudo systemctl start dtm-monitors.timer
Repeat this procedure for each Hyper-Q VM in your environment.
Verify Telegraf is Running
You verify that Telegraf is running using the Azure Portal.
In the Azure Portal, navigate to each Hyper-Q VM on which you installed the Telegraf agent.
In the Monitoring section click Metrics.
Click the Metric Namespace drop-down menu and verify that there is a Custom section with metric names prepended with
telegraf/.Note
It may take several minutes for new metrics to appear.
Figure 1. Verify the Telegraf agent is running.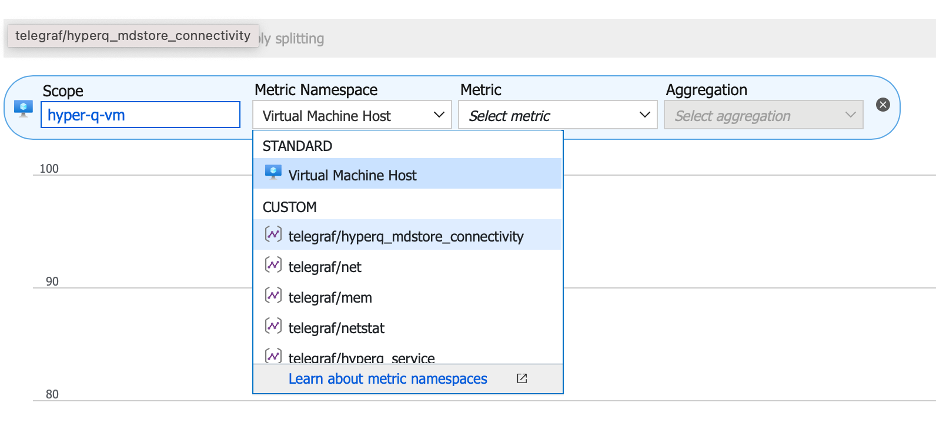
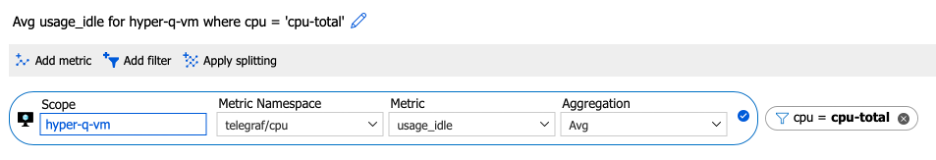
By default, Azure Metrics groups the metrics for all devices, disks, and services, in a single metric.
You can use Filtering and Splitting to gain additional insight into each metric value.
Alert Rules and Notifications
You can create alerts using Azure Log Analytics as a data source.
Alert rules, notifications, and notification methods are unique for each environment. To learn how to configure alerts for your environment, see the Microsoft Azure article Overview of alerts in Microsoft Azure.
Create Alerts Using Azure Log Analytics
You can create alerts using Azure Log Analytics as a data source. To learn more, see the Microsoft Azure articles Respond to events with Azure Monitor Alerts and Create, view, and manage log alerts using Azure Monitor.
The following is a summary of how to create an alert for Hyper-Q using Azure Log Analytics. Refer to the Microsoft Azure documentation for additional information. To create an alert using Azure Log Analytics:
Ensure each Hyper-Q VM is sending log files to Azure Log Analytics.
In Azure, navigate to the Log Analytics Workspace you created for the Hyper-Q VM.
Create a query for the data from which you want to generate an alert.
For example, the query below filters for results in which the message code is DTM3102.
hyper_q_error_log_CL | where RawData contains "ERROR"

| extend CSVFields=parse_csv(RawData)

| extend Timestamp = tostring(CSVFields[0])

| extend Pid = tostring(CSVFields[1])

| extend SessionId = toint(CSVFields[2])

| extend CRID = tostring(CSVFields[3])

| extend LSN = toint(CSVFields[4])

| extend Module = tostring(CSVFields[5])

| extend Line = toint(CSVFields[6])

| extend MessageCode = tostring(CSVFields[7])

| extend LogSeverity = tostring(CSVFields[8])

| extend Message = tostring(CSVFields[9])

| extend QueryString = tostring(CSVFields[10])

| where MessageCode == "DTM3102""
Click + New alert rule from the top of the page to create a new alert.
Using the wizard, create an alert and identify where to send notifications.
Create Alerts using Metrics with Azure Monitor
Azure Monitor Metrics collects numeric data from monitored resources. Metrics are collected at regular intervals and describe some aspect of a system at a particular time.
To learn more, see the following articles in the Microsoft Azure documentation:
The following procedure summarizes how to create an alert on each Hyper-Q VM using metrics from Azure Monitor. Refer to the Microsoft Azure documentation for additional information.
To create an alert using metrics:
In Azure portal, click Monitor. The Monitor blade consolidates all your monitoring settings and data in one view.
Navigate to the resource group or resource for which you want to create a metric-based alert.
Click Alerts then click + New alert rule.
Select a resource for which you want to create an alert.
For example, to alert on the Hyper-Q VM select Virtual machine from the Filter by resource type drop-down menu and select the virtual machine in which you installed Hyper-Q.
When you have selected the Hyper-Q VM, click Add condition.
Select the conditions you want to trigger the alert and click Done.
Metrics for Hyper-Q Monitoring
Metrics allow you to measure, evaluate, and compare performance on your Hyper-Q deployment.
Virtual Machine Metrics
The following metrics report on the Hyper-Q VM. Set the scope to the virtual machine in which you installed Hyper-Q. For example, if you labeled the virtual machine hyper-q-vm, set the scope to that name. Input the values from the tables into the resource scope picker.
Use the scope picker to select resources and add metrics.
High CPU Usage for 30 or More Minutes
Reports high CPU usage for periods of 30 minutes or more.
Scope | Metric Namespace | Metric | Aggregation | Filter and Splitting |
|---|---|---|---|---|
Virtual macine name | telegraf/cpu | usage_idle | Avg | cpu=cpu-total |
High Memory Usage
Reports high memory usage.
Scope | Metric Namespace | Metric | Aggregation | Filters and Splitting |
|---|---|---|---|---|
Virtual machine name | telegraf/mem | available_percent | Avg | cpu=cpu-total |
High Disk Space Usage
Reports percentage of disk space in use.
Scope | Metric Namespace | Metric | Aggregation | Filers and Splitting |
|---|---|---|---|---|
Virtual machine name | telgraf/disk | used_percent | Avg | split by = path |
Hyper-Q Instance Metadata Store Connectivity
Reports Metadata Store network connectivity.
Scope | Metric Namespace | Metric | Aggregation |
|---|---|---|---|
Virtual machine name | telegraf/net_response_synapse | result_code | Avg |
Hyper-Q Service is Not Available
To verify if the service is available, the Network Response plugin verifies if the service is running as reported by the systemd service, and if a process ID from dtm.pid is available.
Network connectivity is also verified using the Network Response plugin. To learn about the metrics the plugin collects, see the InfluxData documentation InfluxData Network Response Plugin.
Scope | Metric Namespaces | Metric | Aggregation |
|---|---|---|---|
Virtual machine name | telegraf/net_response_hyperq | result_code | Avg |
Virtual machine name | telegraf/net_response_hyperq | running | Avg |
Hyper-Q Service is Running
The Systemd Units Plugin collects Linux systemd unit status.
To learn about the metrics the plugin collects, see the InfluxData documentation InfluxData Systemd Unit Plugin.
Scope | Metric Namespace | Metric | Aggregation | Filters and Splitting |
|---|---|---|---|---|
Virtual machine name | telegraf/systemd_units | active_code | Avg | dtm.service |
Hyper-Q Service with Azure Load Balancer Unavailable
To verify if the Azure Load Balancer is operating properly, use the Azure metrics provided by the Load Balancer scope.
To learn more, see the following articles in the Microsoft Azure documentation:
Unexpected Error Codes
If you receive unexpected error codes in either the Hyper-Q log files or log shipper logs, use the Azure metrics provided by the Log Analytics scope.
To learn more, see the following articles in the Microsoft Azure documentation:
For errors in the Hyper-Q log files, in addition to setting the scope to Log Analytics, specify the Azure Monitor metric Log Analytics Saved Query.